Case Study · Multiple Shopify DTC Brands
Multi-store Shopify DTC scaling: 6 brands, 4-figure ROAS each
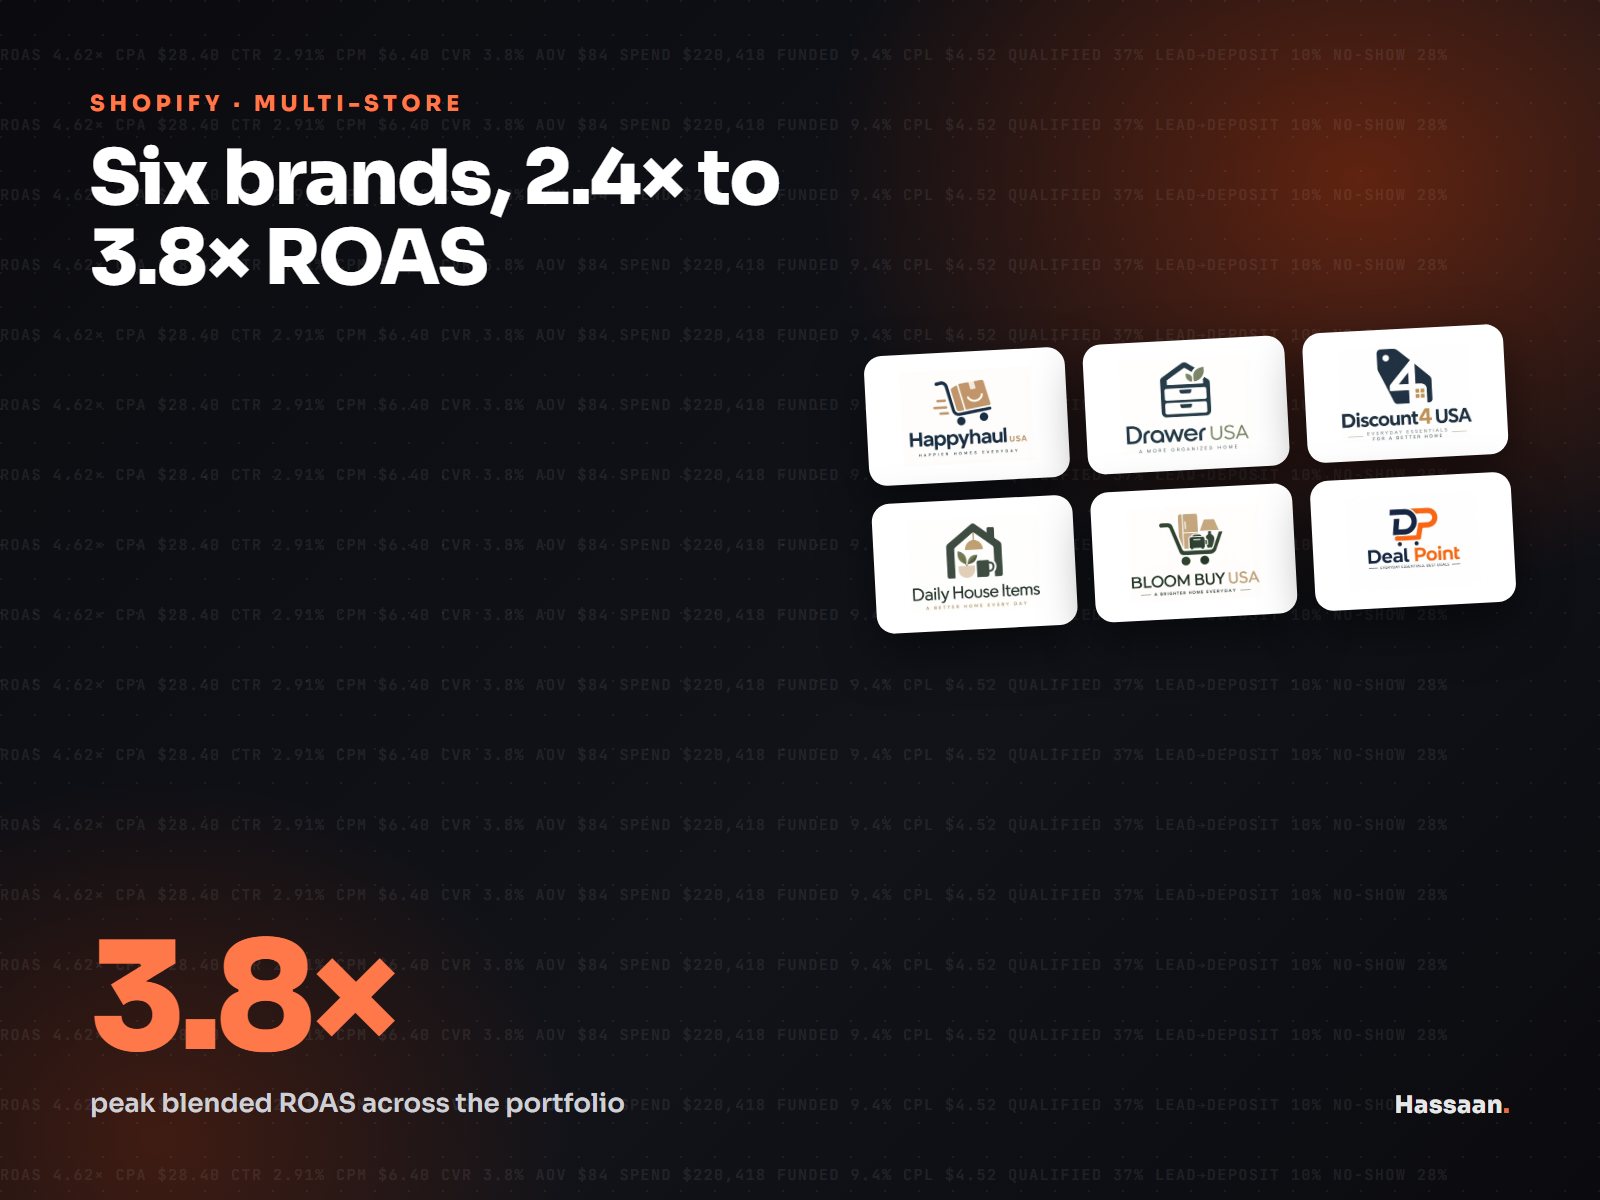
Six Shopify stores, simultaneous management. Paid media + store ops + product-level ROAS optimization across fashion, lifestyle, and consumer product categories.
The Engagement
Who they are.
Six DTC brands across fashion, lifestyle, and consumer-product verticals. End-to-end Shopify store management plus paid media. product listing, pricing strategy, ad creative direction, audience targeting, and conversion optimization. The first paid-media engagement that built foundational expertise across the full DTC customer journey.
The Challenge
The starting point.
Manage paid media and store operations across 6 Shopify brands simultaneously, each with different products, audiences, margin profiles, and growth stages. Some were brand-new launches with no pixel data; others were scaling brands with existing audiences. The discipline of running 6 stores at once forced systematic thinking. what worked across brands vs what was brand-specific.
Constraint 1: Six concurrent brands at different growth stages
Constraint 2: Each store had distinct unit economics. no one-size playbook
Constraint 3: Limited budget per brand meant prioritization had to be sharp
The Strategy
What we actually did.
Three operational principles that let us run 6 brands without each one becoming a fire drill.
Standardized creative testing framework across brands
Same testing structure (3-5 angles, weekly kill/scale decisions, monthly creative refresh) applied across all 6 brands. Standardization meant cross-brand learnings: a hook angle that worked for one fashion store could be tested in another store the next week.
Product-level ROAS tracking, not store-level
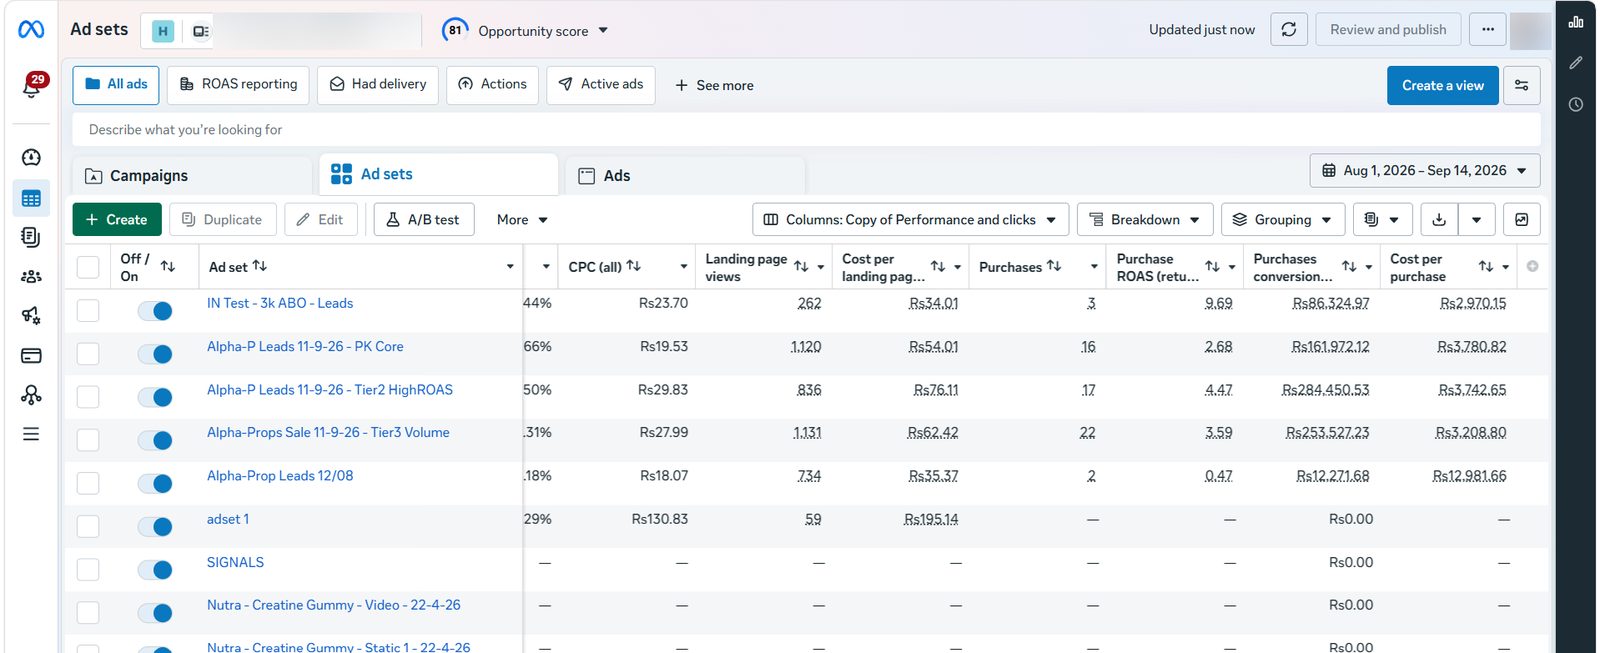
Most agencies track store-level ROAS and miss the product mix story. We tracked product-level ROAS. sometimes 80% of profit came from 20% of SKUs. Budget got reallocated to those SKUs across brands; underperforming SKUs got paused regardless of which store they belonged to.
End-to-end customer journey ownership per brand
Not just ads. also product page optimization, checkout flow refinements, cart-abandonment sequences. The biggest gains often came from fixing the conversion experience, not the ads themselves.

Results
The transformation.
Built foundational understanding of DTC unit economics across categories. ROAS range across stores: 2.4×–3.8×. The systematic approach to multi-brand management became the template for every later DTC engagement, including Glowrish Pharma's 4.6× launch.
Fashion · lifestyle · consumer products.
Across the portfolio. variance reflects different unit economics.
Standardized framework across all 6.
Often 80% of profit came from 20% of SKUs. budget rebalanced accordingly.
What we'd do next
The next chapter.
For any new DTC engagement, this multi-brand experience informs faster diagnosis: which SKUs to lead with, which audiences to seed, which channel to prioritize first. The systematic 12-creative-monthly testing framework that powered Glowrish was built here.
Running a Shopify store and stuck on scaling?
Most DTC scaling problems aren't ad problems. they're unit-economics problems hiding inside SKU mix. Book a 15-min review of your current setup.
More case studies
View all →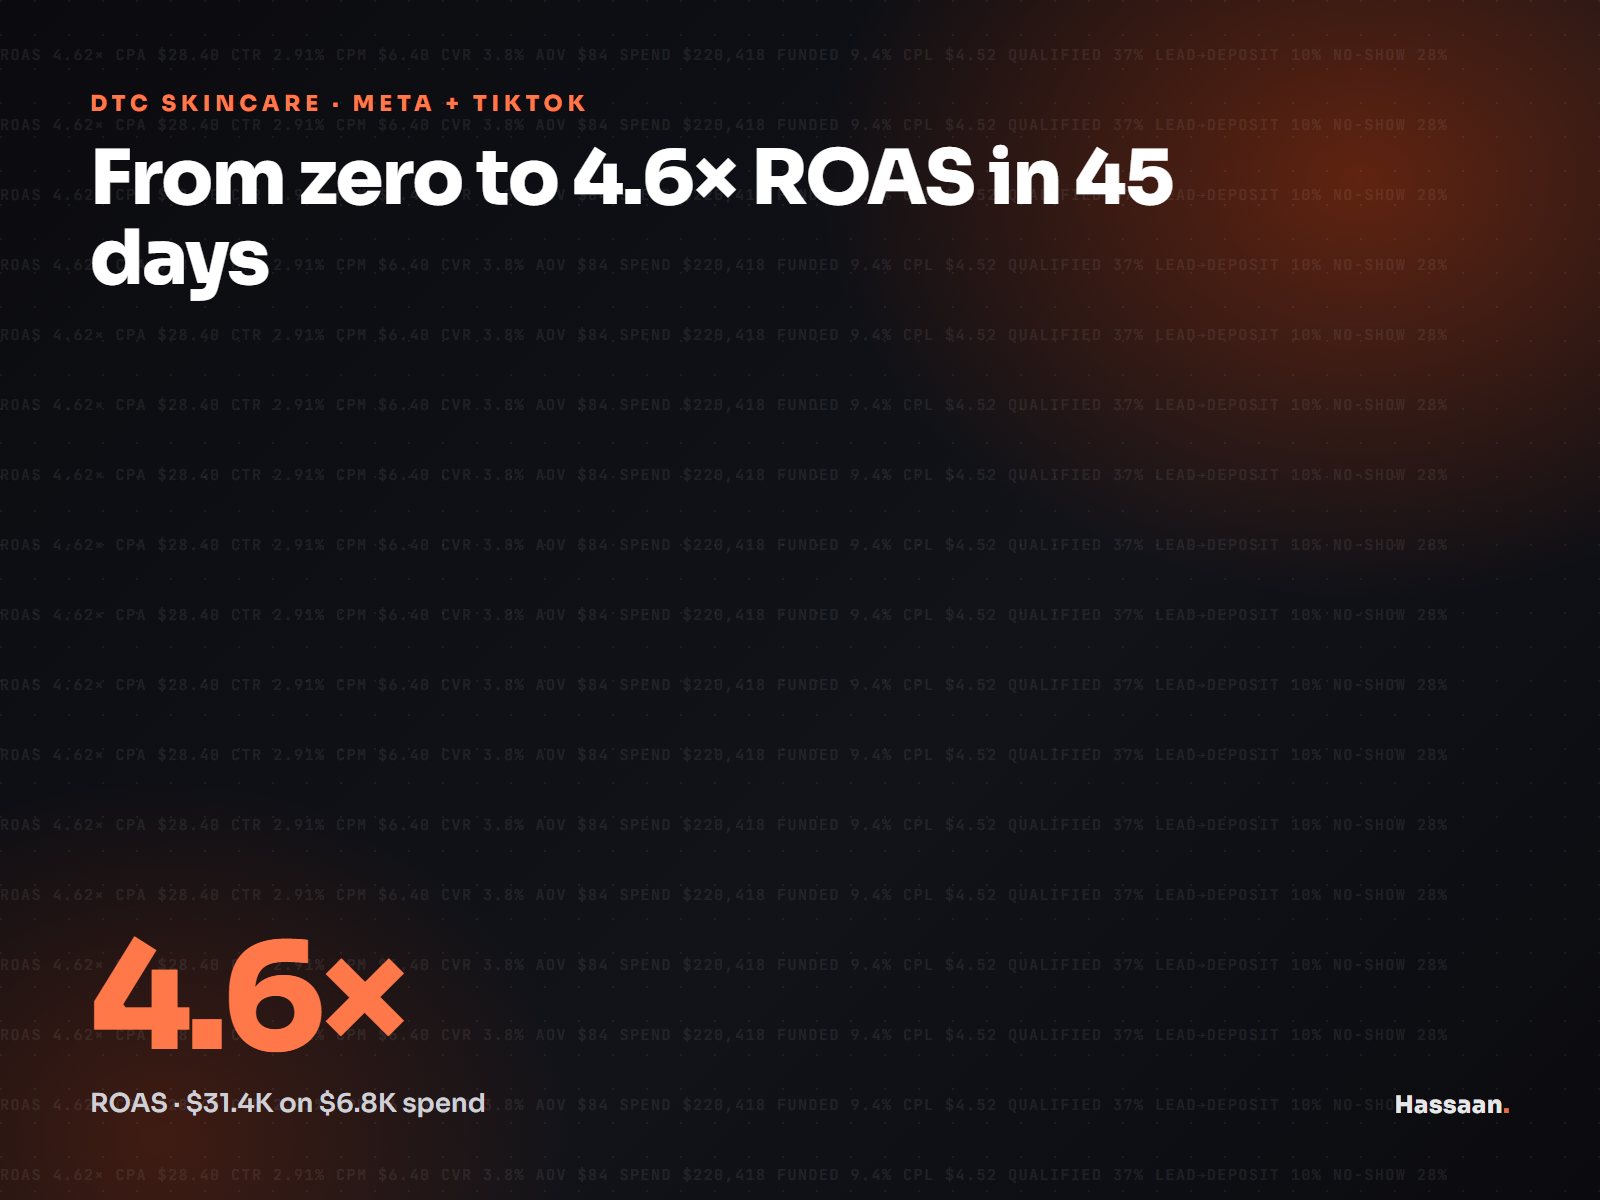
Glowrish Pharma
4.6× ROAS in 45 days for a brand-new D2C skincare launch
Maryam Derma Clinic
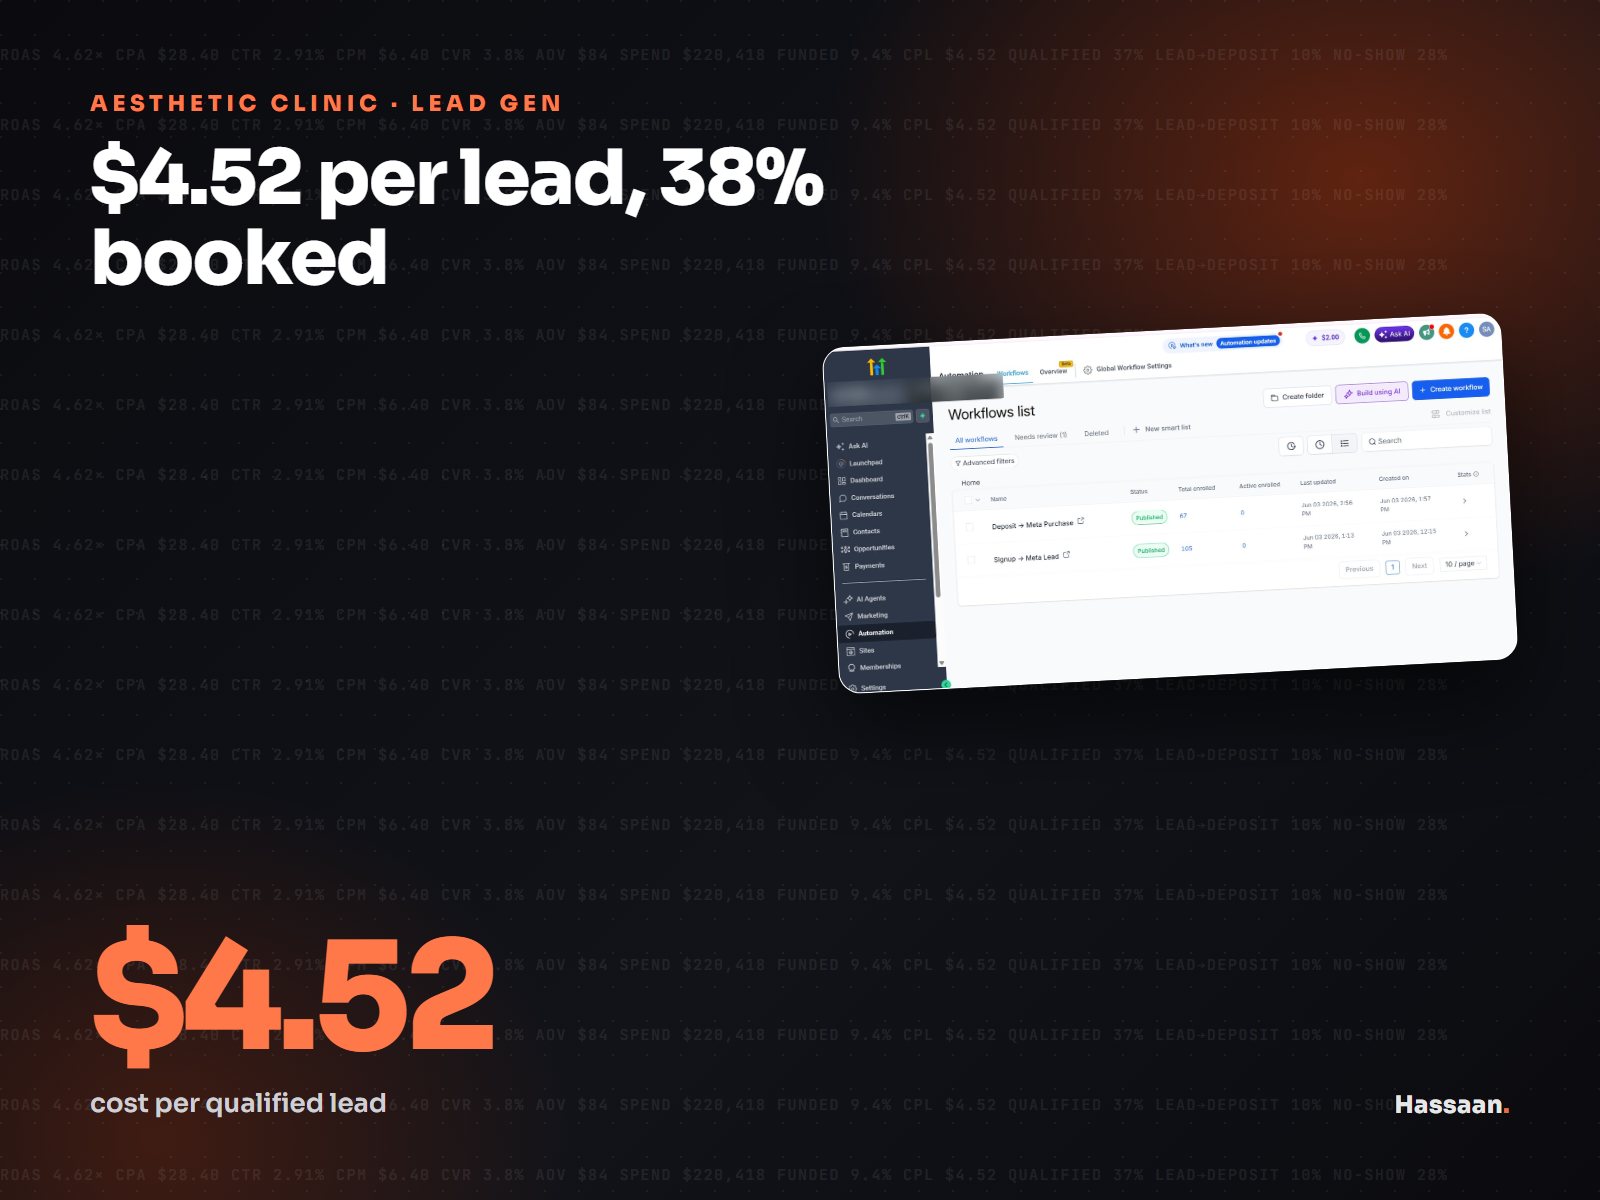
$4.52 cost per lead and 38% booking rate for a dermatology clinic
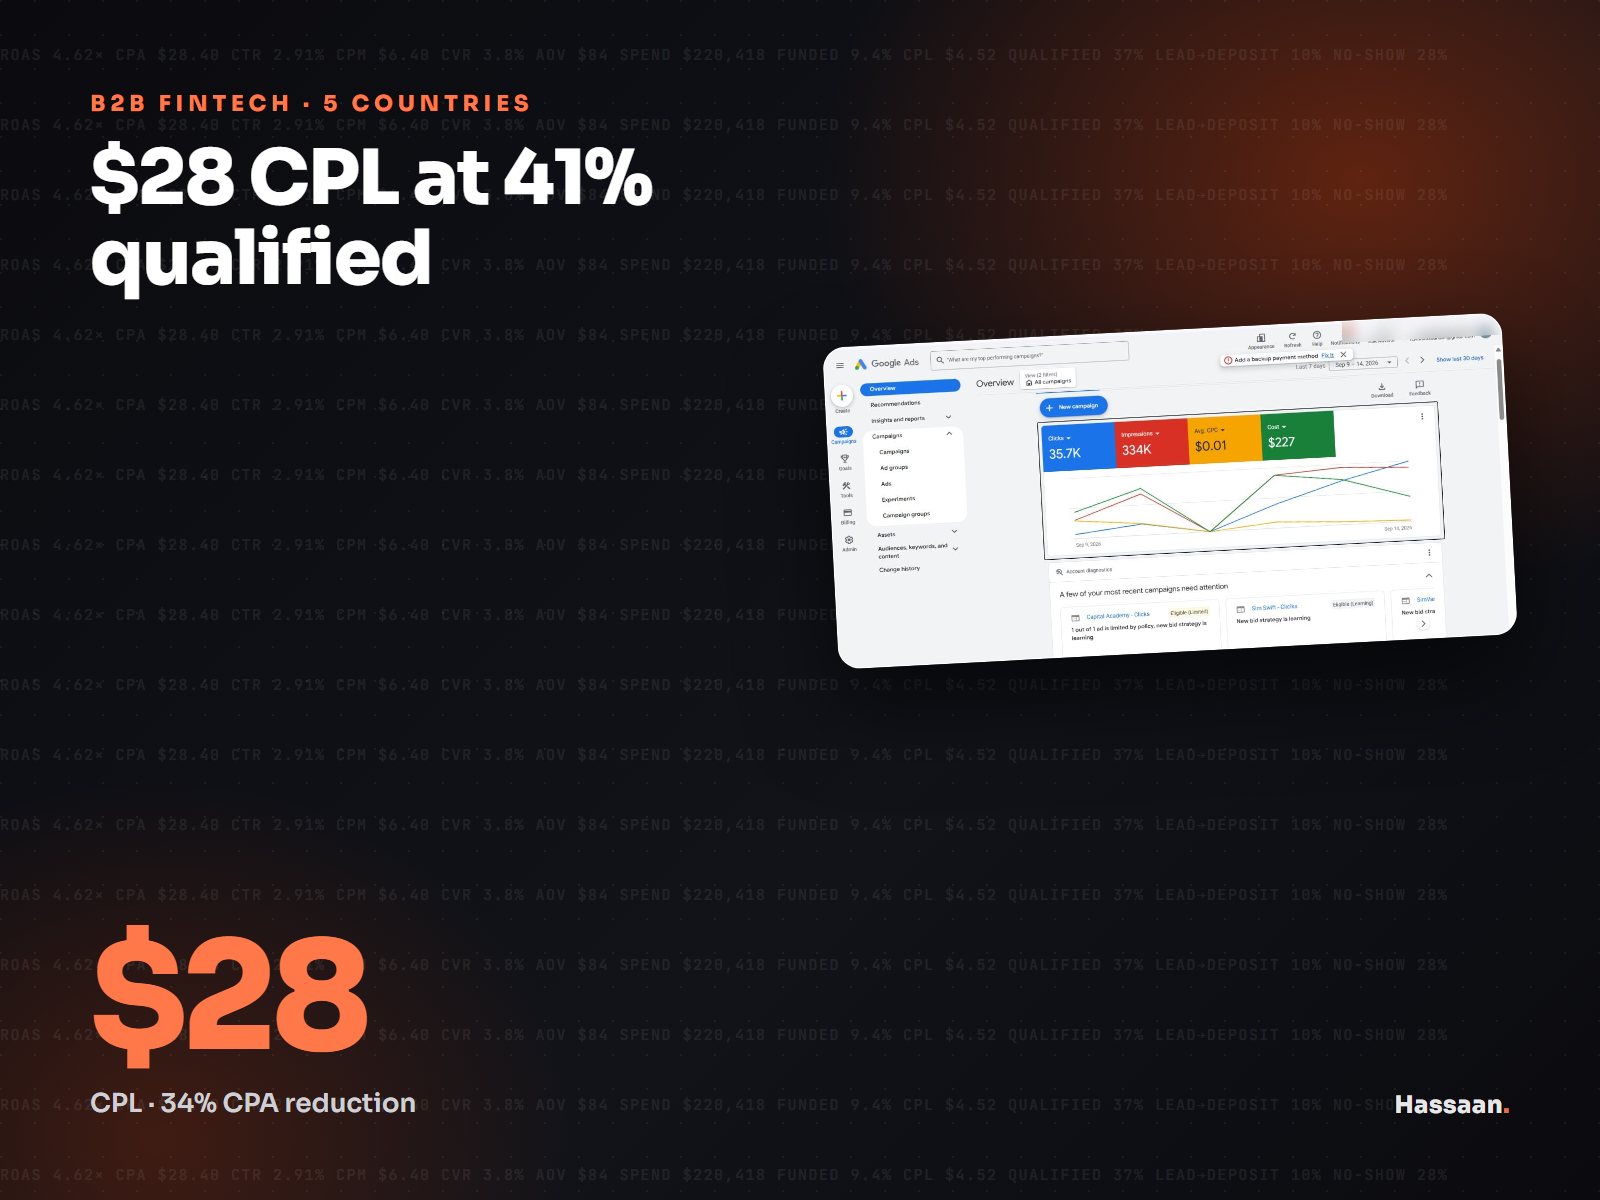
Payalma
B2B FinTech scaled across 5 countries at $28 cost per lead

Dar Developers
Generated 86 HNW investor leads at $94 CPL for Dubai real estate
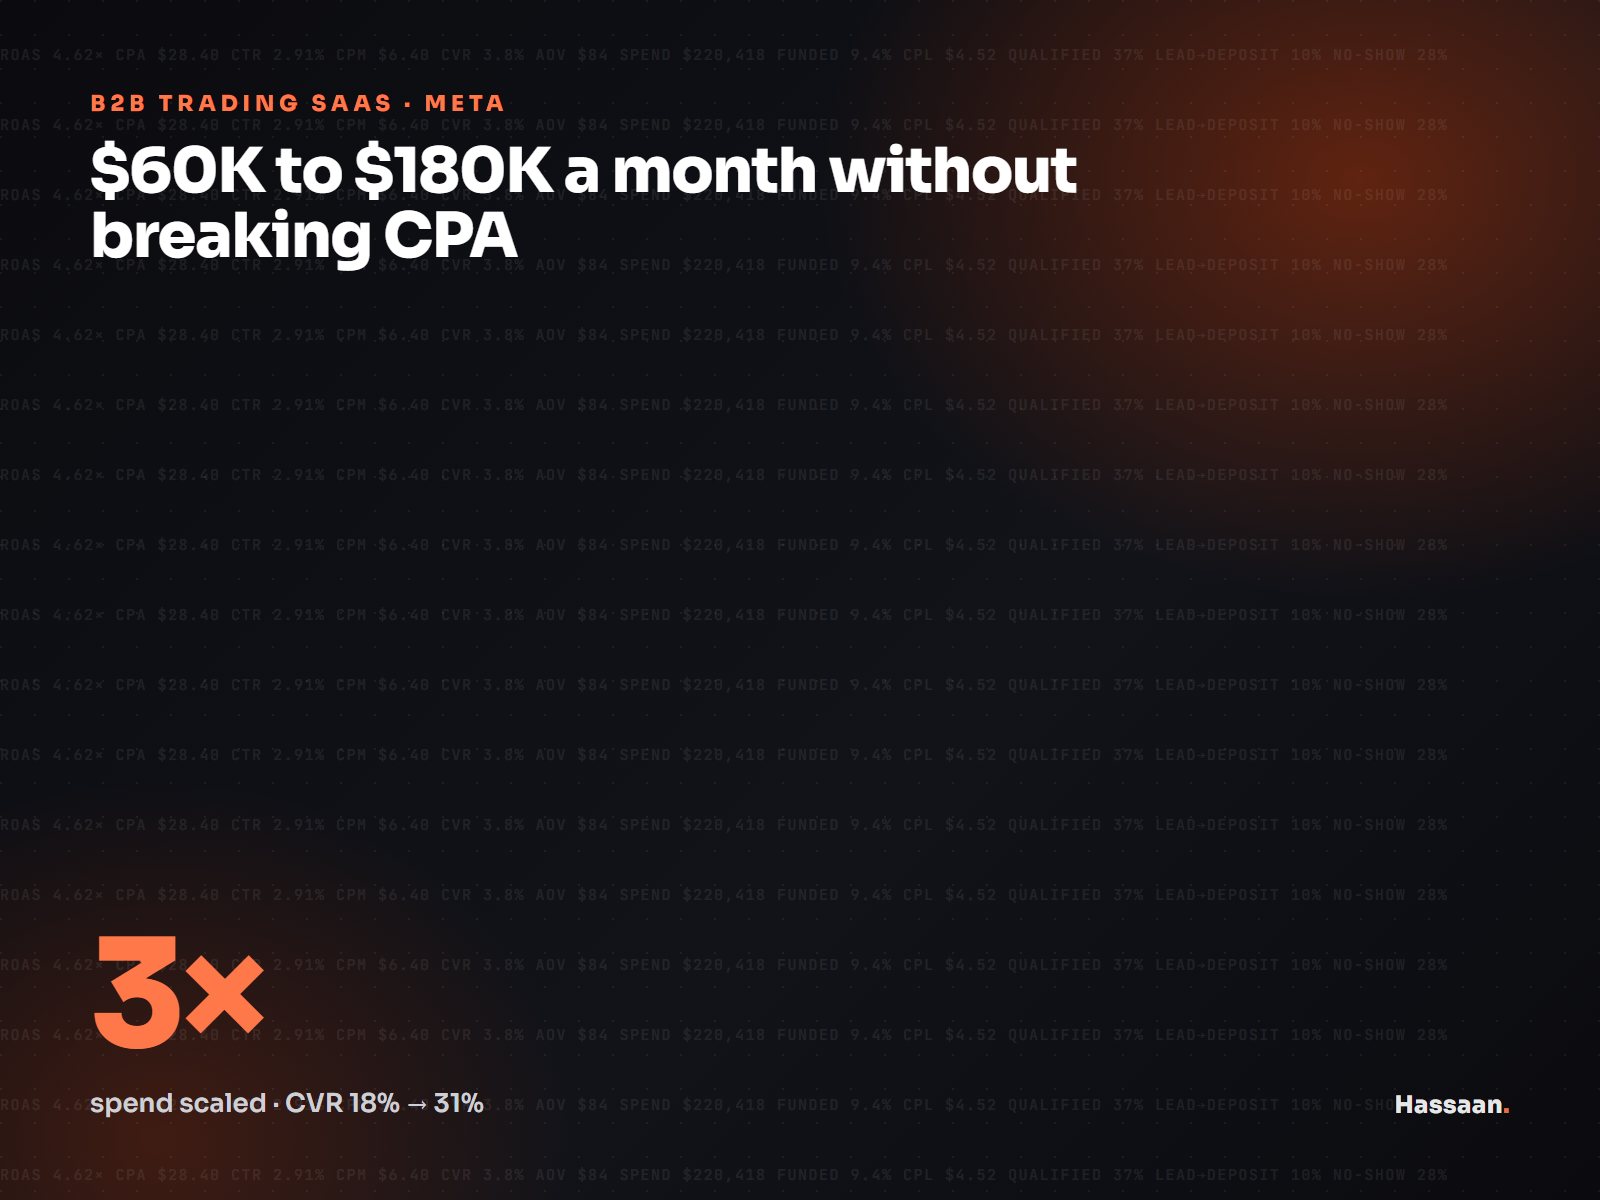
Confidential. B2B Trading Software
Scaled a B2B trading SaaS from $60K to $180K/month Meta spend
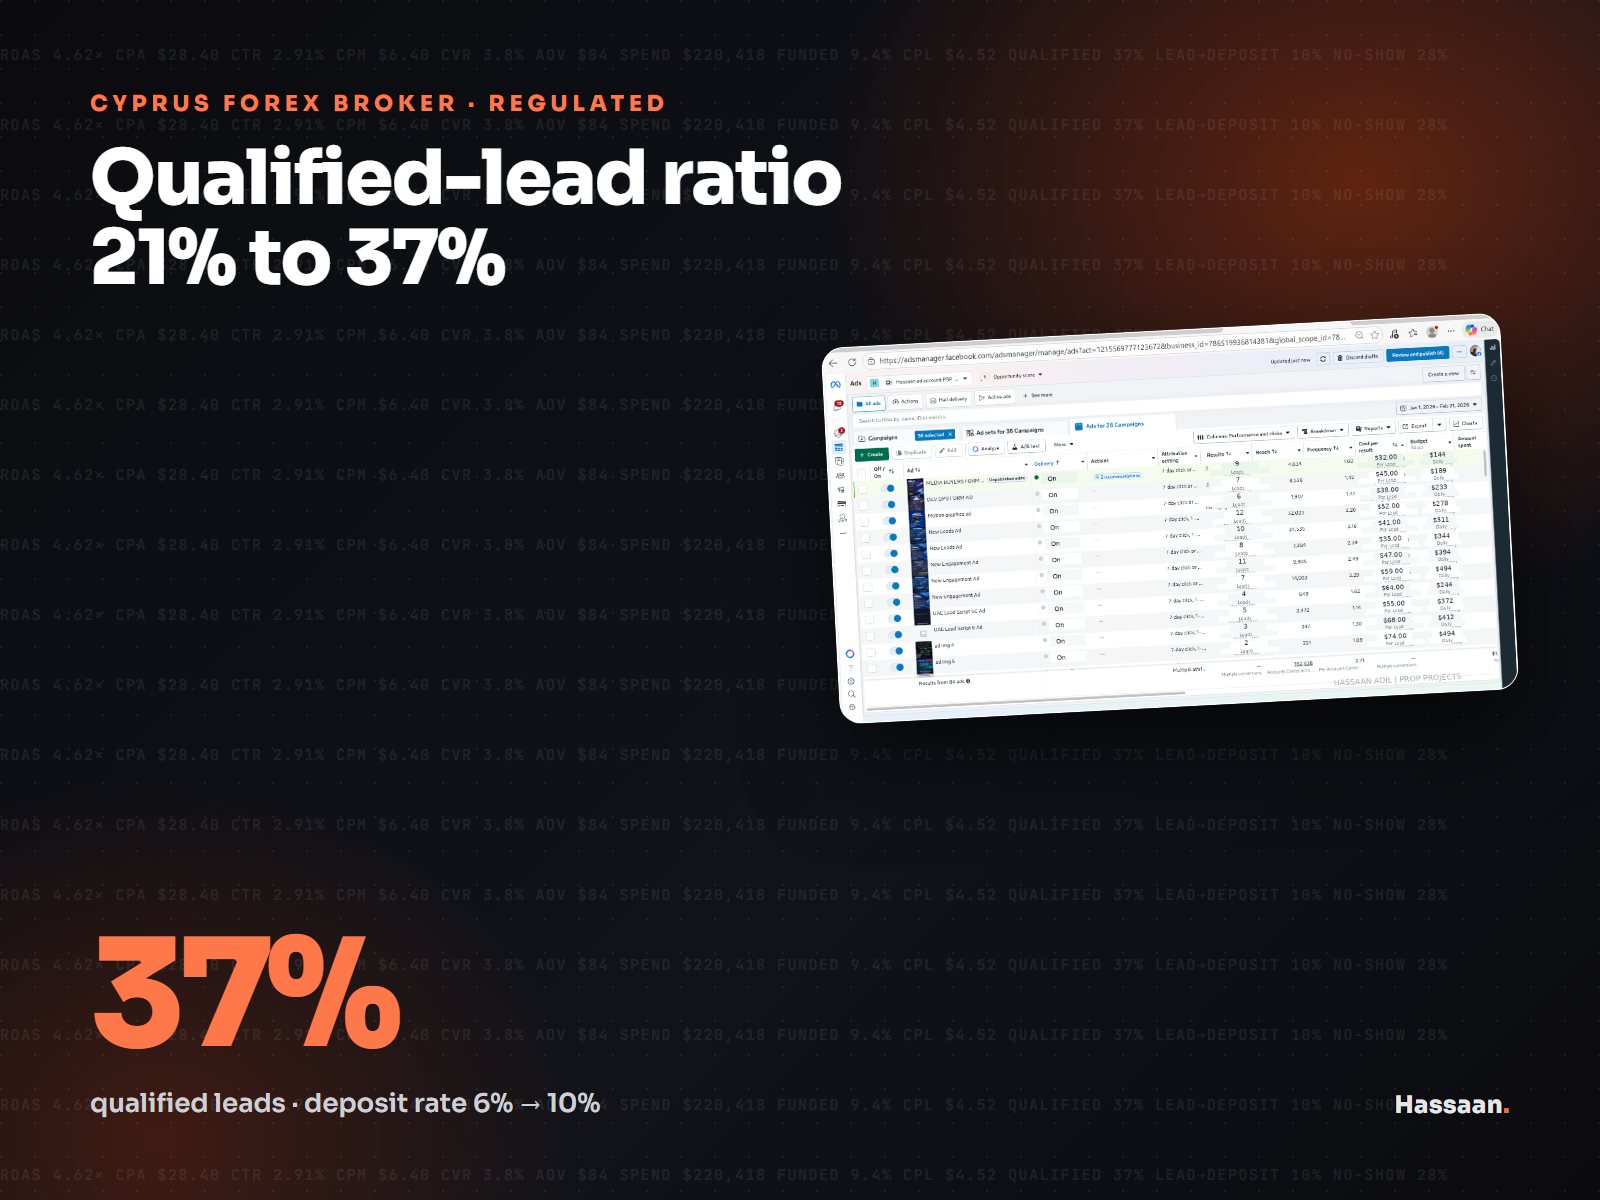
Confidential. Cyprus Forex Broker
Cyprus Forex broker: qualified-lead ratio from 21% to 37%
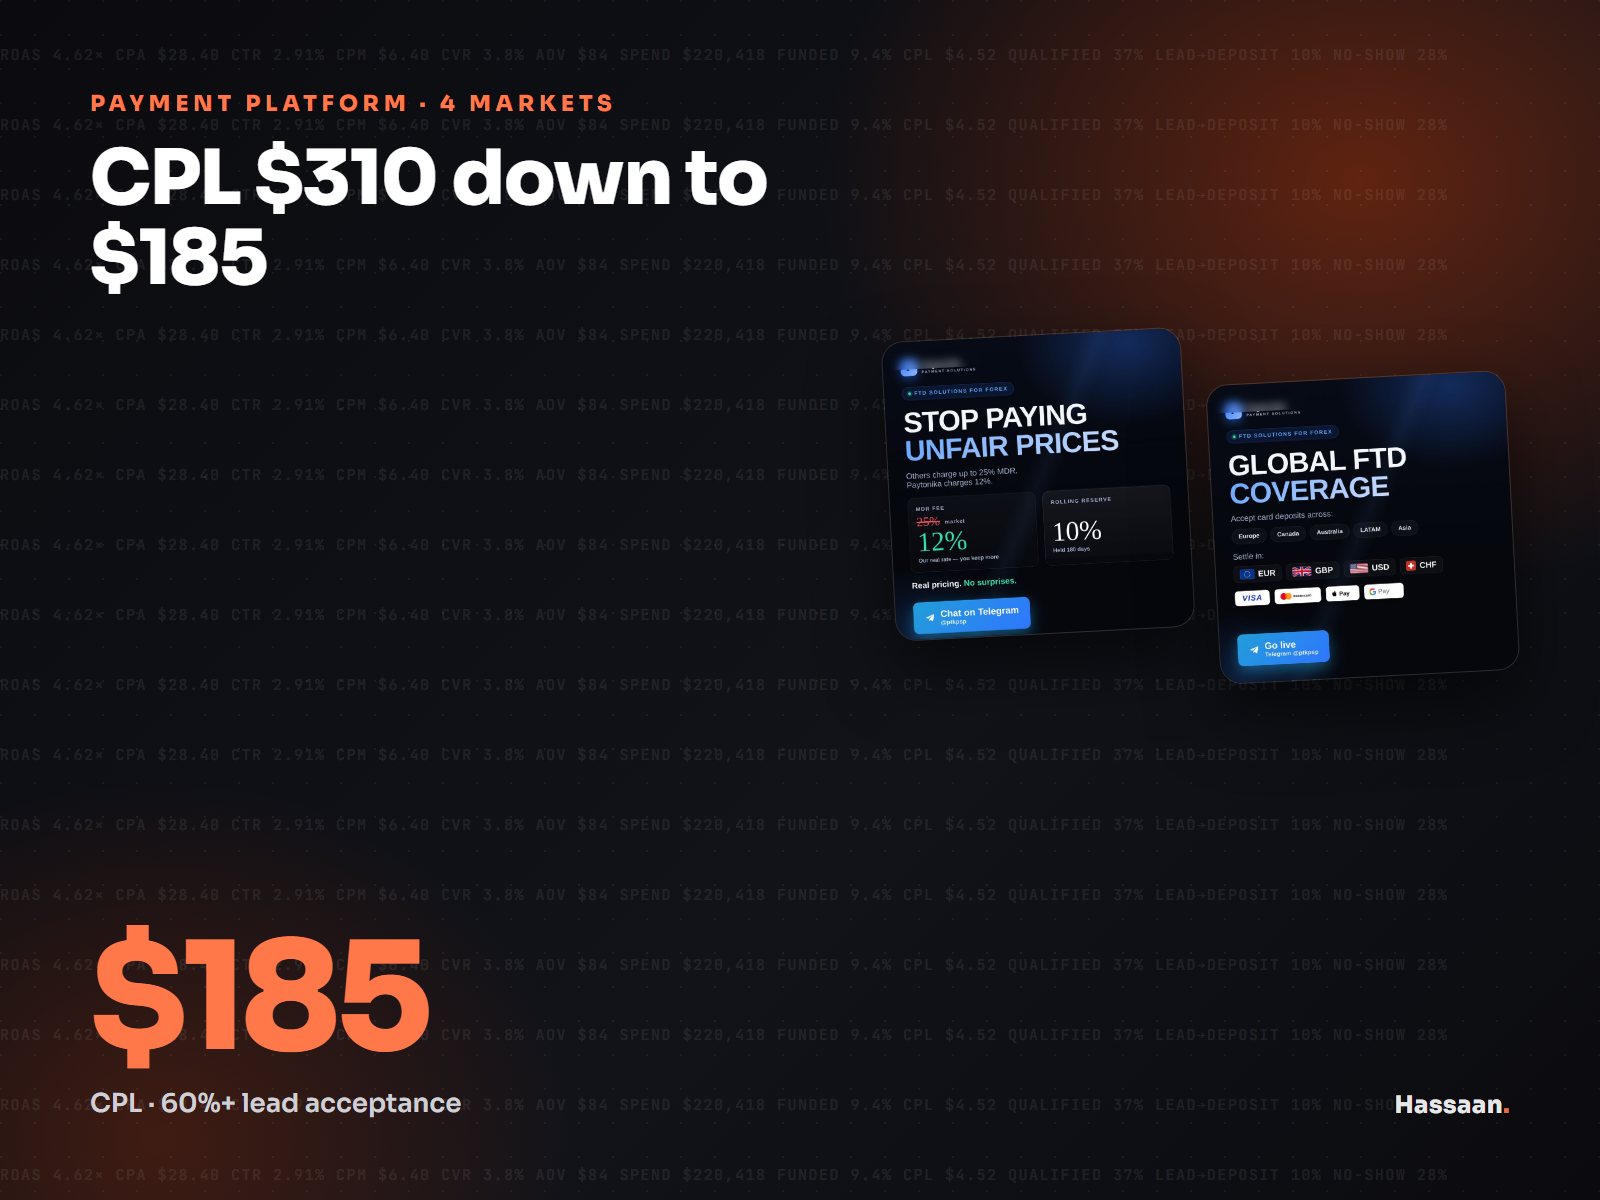
Confidential. Payment Solutions Platform
Cut B2B FinTech CPL from $310 to $185 across 4 international markets
Confidential. Affiliate Marketing Operations
Scaled affiliate operations from 3 to 12+ partner networks

Forex Leads (B.H.)
Built 5-market Forex lead engine with full affiliate tracking infrastructure

Apex Capital Funded
$28 cost per challenge and 9.4% pass-to-funded rate for a Forex prop firm
Velocity Trader Capital
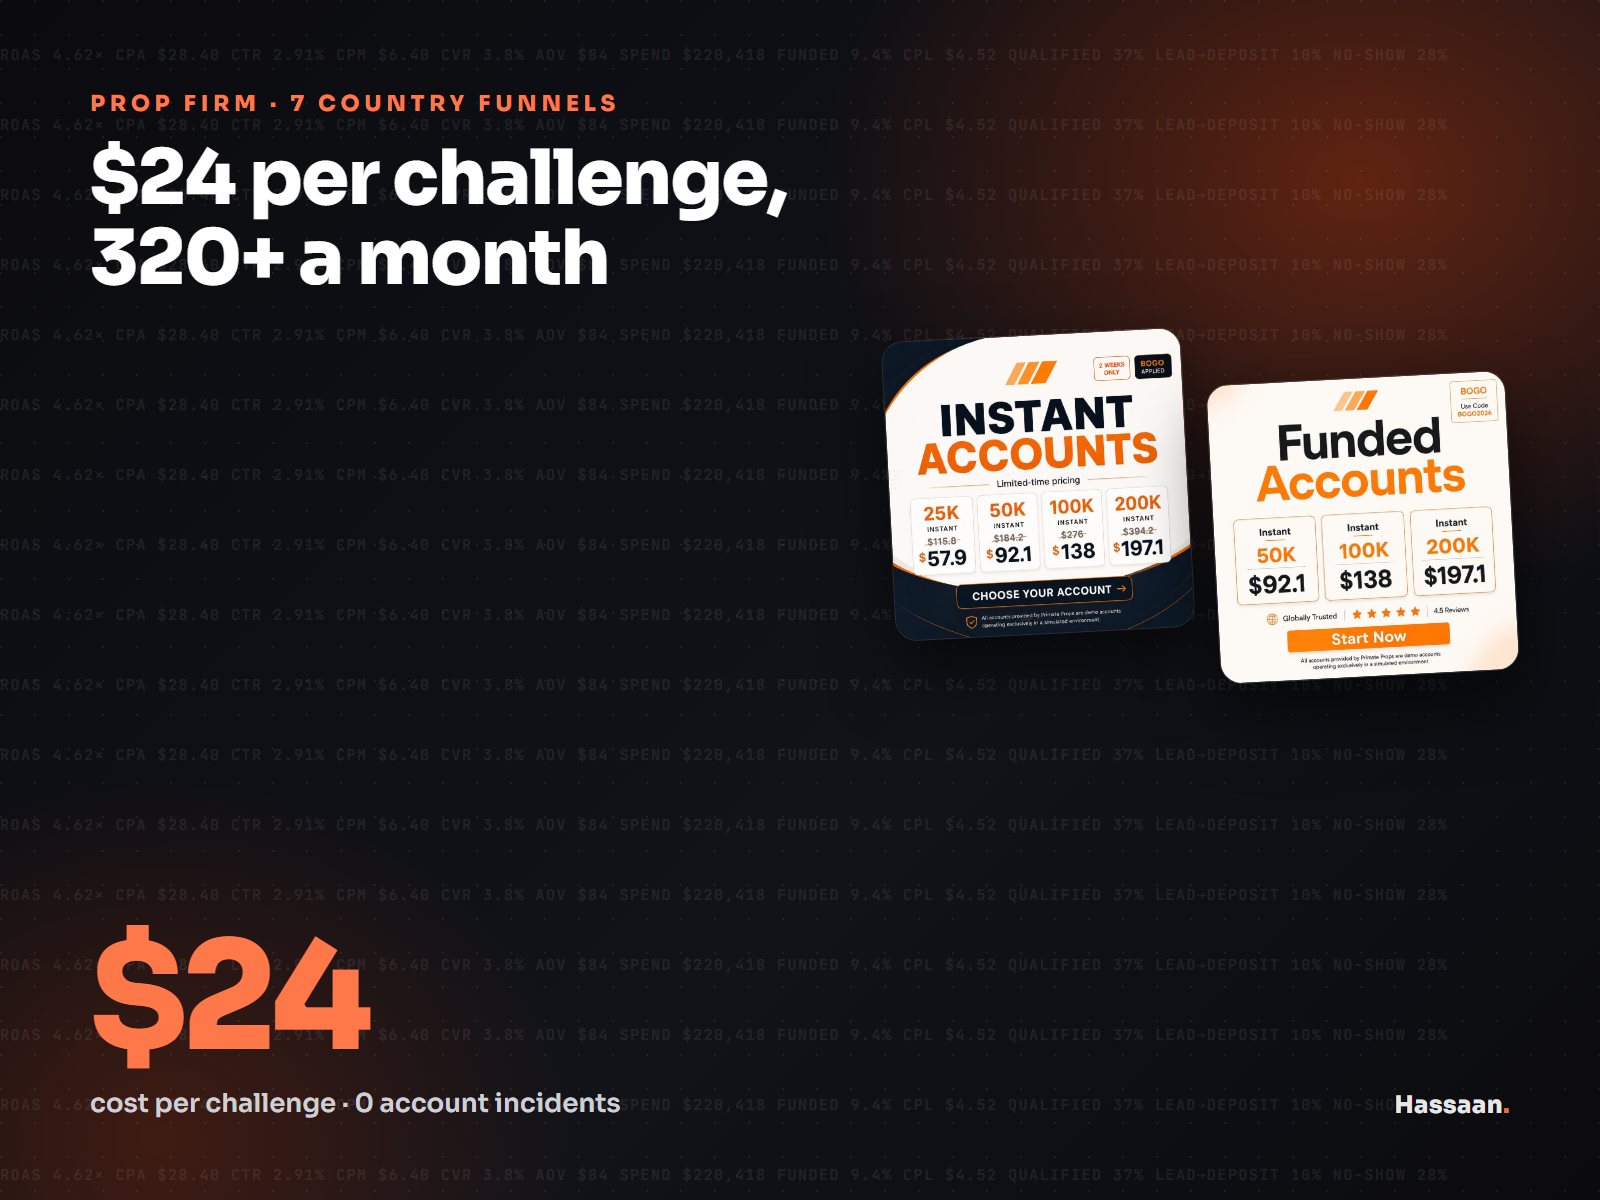
320+ monthly challenge purchases at $24 CPA across 7 emerging markets
Crescent Funded